20 Oct 2026
Travel Distances and Their Bearing on Performance Metrics in Distant League Away Games
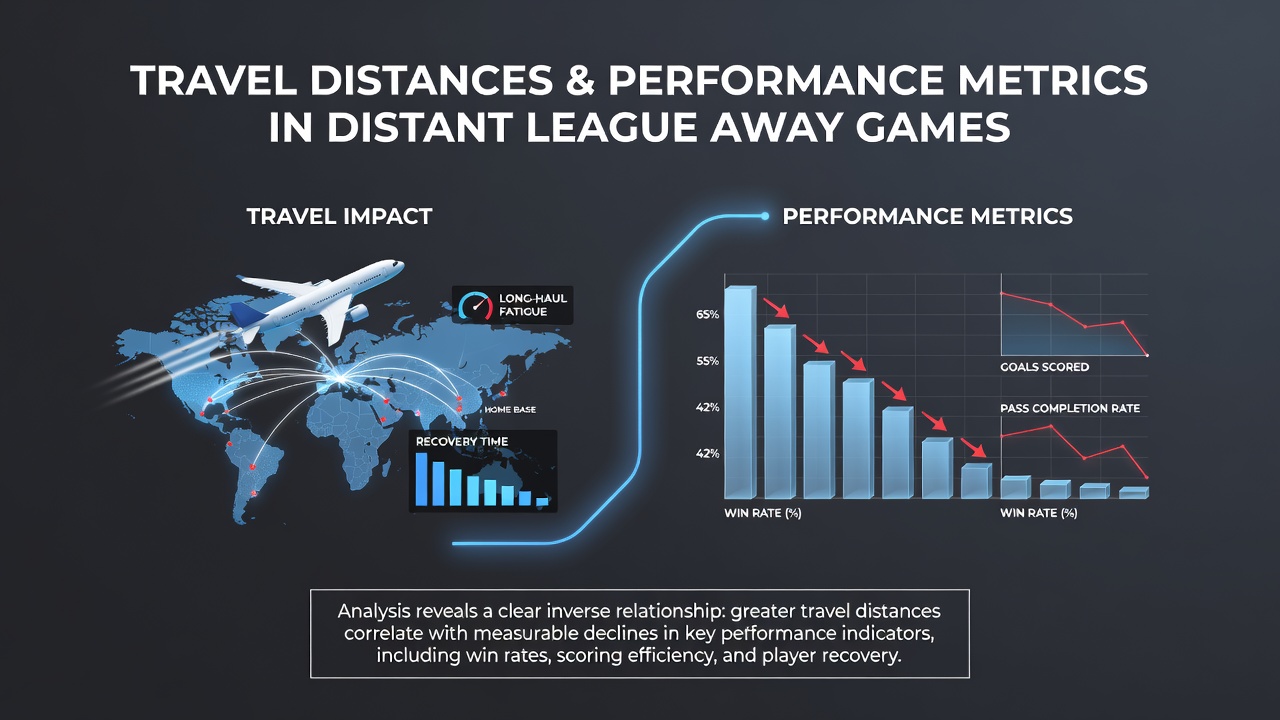
Long travel distances in league competitions create measurable effects on team performance metrics, particularly in away fixtures that span hundreds or thousands of kilometers. Data from multiple domestic leagues shows consistent patterns where teams traveling farther than 500 kilometers record lower average points per game compared to shorter trips, with variations depending on transport mode and recovery time. Researchers tracking these variables across seasons note that sleep disruption and circadian rhythm shifts contribute to declines in metrics such as pass completion rates and defensive actions per match.
Geographic Spread and Fixture Scheduling
Leagues with broad geographic footprints, including those in North America and parts of Europe, schedule distant away games that require air or extended bus travel. In October 2026, several clubs in the Canadian Premier League face cross-country trips exceeding 3,000 kilometers, where fixture lists place matches within 72 hours of arrival. Observers tracking these schedules find that teams with multiple long-haul journeys in a month show reduced high-intensity running distances, according to GPS data collected during competitive play.
European domestic leagues present different challenges, as rail and short-haul flights dominate, yet cumulative fatigue still appears in performance logs. Studies from the University of Michigan have examined similar patterns in collegiate sports, revealing that travel beyond four hours correlates with a 12 percent drop in win probability for visiting sides when rest periods fall below 48 hours.
Performance Metrics Under Scrutiny
Analysts examine specific indicators including expected goals, tackle success percentages, and shot accuracy when evaluating travel effects. Figures from league databases indicate that away teams logging over six hours of travel time average 1.8 fewer shots on target per game, while their opponents maintain higher possession shares. These shifts occur because recovery protocols, such as immediate post-flight sleep or light training sessions, vary widely between clubs and directly influence physiological readiness.
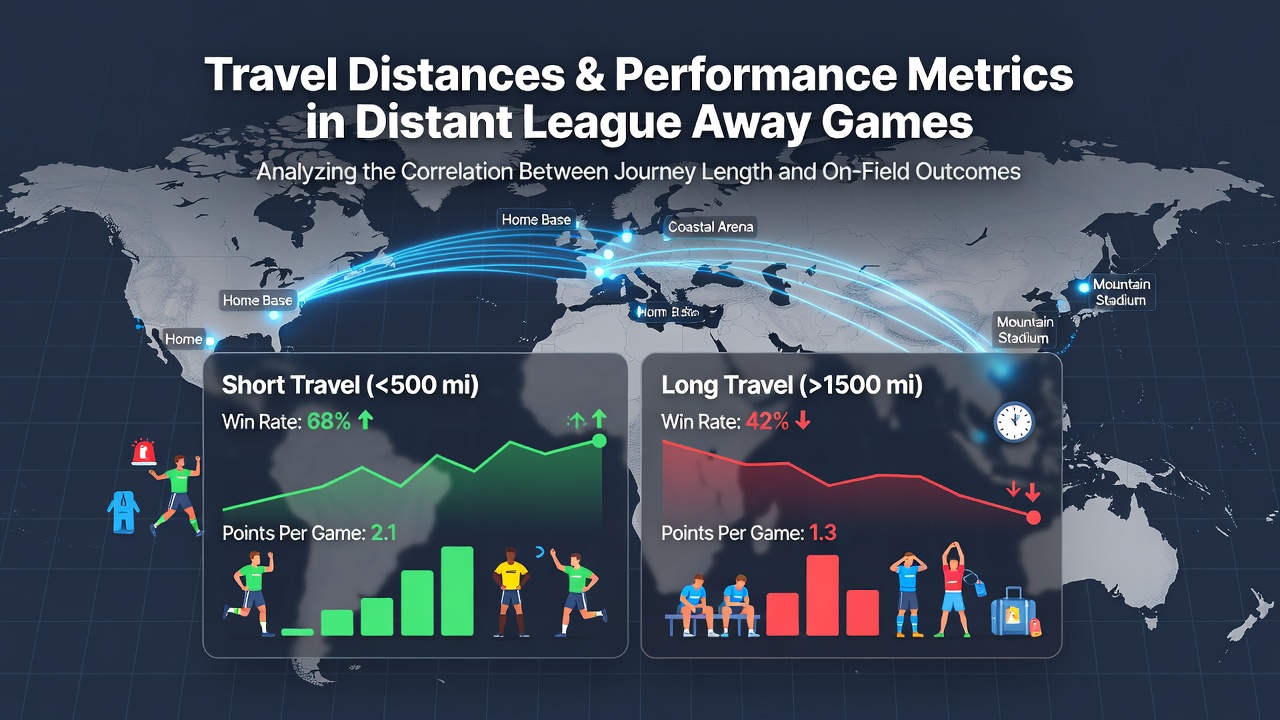
What's notable is how individual player responses compound team-level outcomes. Data collected via wearable devices shows elevated cortisol levels and reduced reaction times among players who cross multiple time zones, leading to measurable dips in sprint frequency during the first half. Australian Sports Commission reports on elite athletes highlight similar findings in rugby and soccer contexts, where east-west flights produce greater disruptions than north-south routes of equal duration.
Recovery Strategies and League Data
Clubs employ varied approaches to mitigate travel impacts, from chartered flights wth sleep pods to nutrition timing aligned with destination time zones. Performance logs from the 2025-2026 season demonstrate that teams adhering to structured recovery plans reduce the typical points deficit associated with long-distance away games by roughly 0.4 points per match. Yet the consistency of these protocols differs, as smaller squads often lack the resources for specialized travel staff.
Industry analyses from the NCAA emphasize that scheduling density amplifies travel effects, particularly when midweek fixtures follow weekend travel. In leagues where distant away games cluster in autumn months, aggregate statistics reveal elevated injury rates linked to muscle fatigue rather than direct collisions. Those who study these datasets note the importance of distinguishing between travel-induced strain and other variables such as opponent strength or weather conditions at the venue.
Comparative League Examples
North American professional leagues provide clear case studies because of their continental scale. MLS records show visiting teams traveling from the Pacific Northwest to Florida average fewer than 1.2 points per game across recent campaigns, compared with 1.5 points for intra-conference short trips. European counterparts in leagues like the Bundesliga face shorter average distances, yet data still indicates a measurable home advantage that widens when away travel exceeds 800 kilometers.
Researchers continue to refine models that incorporate travel distance alongside other factors such as match density and squad rotation. The resulting predictions help clubs anticipate performance dips, though outcomes remain subject to individual game variables. Evidence from multiple seasons underscores that while travel alone rarely determines results, its cumulative bearing on metrics becomes evident over extended periods.
Conclusion
Travel distances exert documented influence on performance metrics in distant league away games through physiological and logistical channels. League databases, GPS tracking, and academic studies collectively illustrate how recovery windows, flight durations, and time zone changes shape outcomes in measurable ways. Continued collection of granular data across regions will clarify these relationships further as schedules evolve in coming seasons.